Google Analytics is a powerful tool that is absolutely essential for taking your online business to the next level. Google Analytics provides valuable information that will help to improve your website’s performance, increase conversions and help you to understand what your audience wants most.
Why Use Google Analytics?
Aside from being a free tool that’s easily installed with just a piece of code, here are a few additional reasons why you should use Google Analytics:
- You can create customized reports based on your needs
- Get to know more about your visitors and their behavior
- See how people get to your website as well as understand why visitors aren’t sticking around
- Use Google Analytics’ valuable data to make strategic and informed business decisions
If you haven’t already installed Google Analytics on your website, check out our step-by-step guide to get started.
Familiarize Yourself with the ABCs of Google Analytics…
Let’s walk through some of the most powerful dashboard views that Google Analytics has to offer. Known as the ‘ABCs of Google Analytics’, let’s walk through 3 essential components within your GA account.

A is for Audience
Do we build our websites for our own benefit? Of course not! We create these sites to attract and cater to the undying love and attention for our audience! So of course it’s no secret that one of the biggest and most powerful pieces of data is centered around our visitors and what landed them on our site in the first place. So when you click on the Audience tab, you’ll notice that it answers a number of very important questions including:
- How many users visit your site on an hourly, daily, weekly and monthly basis?
- How many of these visitors arrive organically, via social or a referral link?
- Where is the world to your users live?
- What devices are your visitors using to visit your site?
- How many of those visitors return time and time again?
B is for Behavior
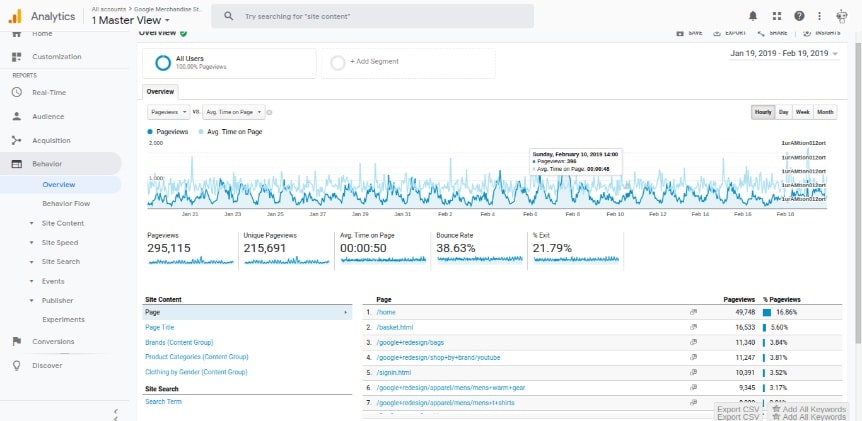
Behavior reports tell you what your website visitors are actually doing on your site. It shows the specific pages people are visiting, how long they spend on each page and where they go next. It allows you to clearly see which pages are generating the most interest and the pages that are causing the most people to bounce. You can also track the top entry and exit pages on the site as well. This is all incredibly important information to have when it comes to fine tuning your marketing strategy.
C is for Conversions
So what do we mean by conversion? A conversion occurs when a visitor takes a desired action. These actions should be determined beforehand and could include things like opting in to your newsletter, signing up for a webinar or purchasing an e-commerce product. The percentage of total visitors that convert is considered your conversion rate. Second, it’s imperative that you determine the main purpose of your website. Is it to enhance visibility tool or build relationships (or both)? Are you selling a service or products? How do you plan to craft your message in order to move your customers through this process? Once you’ve taken the time to answer these questions, you can begin to set up goals within Google Analytics. These goals are broken down into 2 buckets:
- Macro Goals – i.e. the things that directly generate revenue for our business
- Micro Goals – i.e. the positive activity from our website that may not contribute directly to revenue
Once these goals are in place, you can begin to track these metrics and use this data to tweak your efforts and increase your conversion rate!
The Devil is in the Details: GA Reports
Reading these reports might be complex for beginners but we will make sure to provide you with insights on how to understand it well. Besides, these reports are important for your market visibility to help you determine which areas you need to improve on.
Real-Time Reports
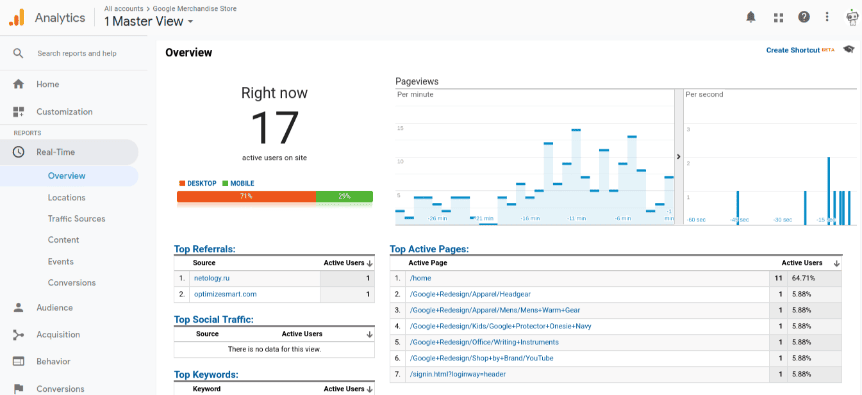
Real-Time reports allow you watch the traffic flow real-time to your website. It provides useful information such as the number of active viewers, your most popular pages, top keywords that are being searched the most and more.
Audience Reports
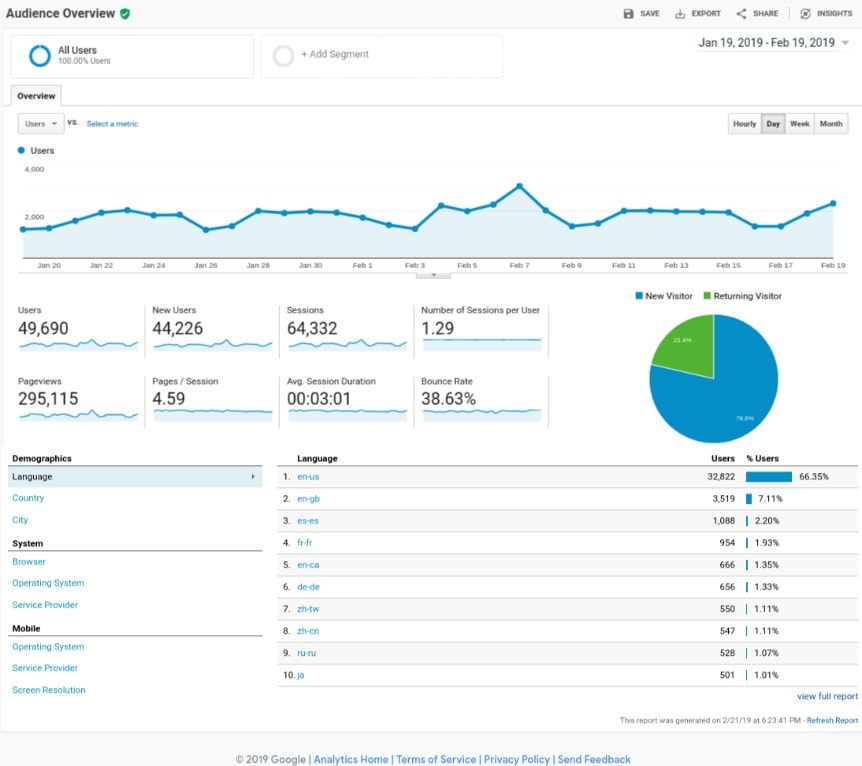
The Audience report has 15 sub-sections, making it the largest section in Google Analytics. It allows you to drill down and access detailed information about your visitors such as age, gender, location, interests, and even the browser and operating system they used.
Acquisition Reports
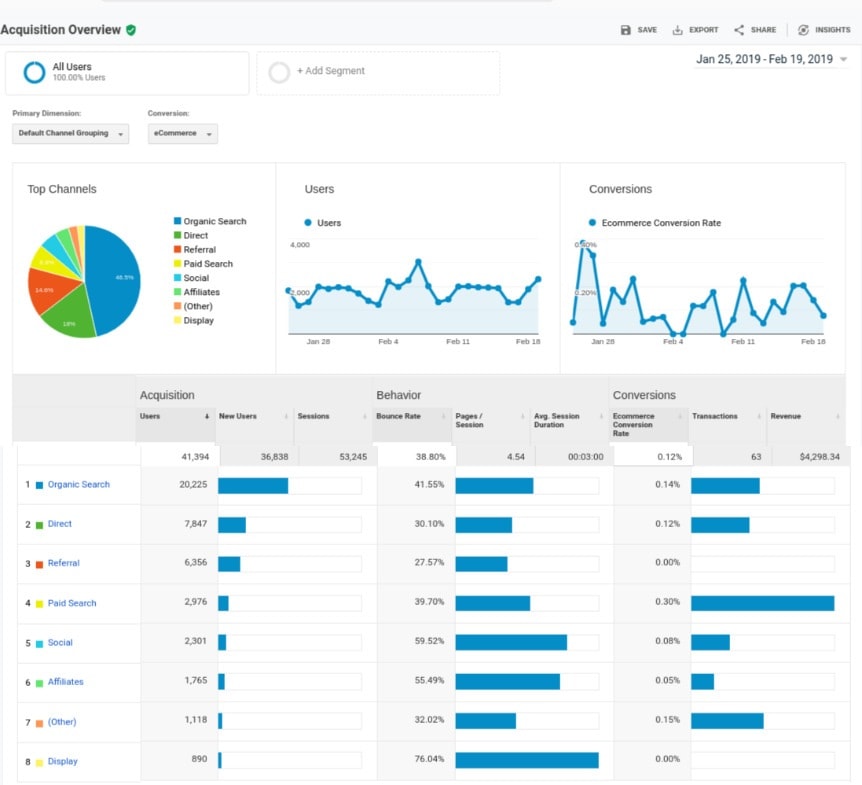
Acquisition reports will tell you where your visitors originated from and how they landed on your website. This is where you can pinpoint what drives the most traffic and conversions, may it be direct, organic, referral or from social media.
Conversion Reports
Conversion reports is the most important metric because this tells you the action your visitors take before conversion. Google Analytics is invaluable when it comes to providing information that helps you maximize your website’s performance. If you still don’t have Google Analytics, then it’s time to start setting it up to enhance your digital marketing plans.